Dakhl — Redesigning SnappFood’s CPC Ad Platform
From a confusing MVP to a million-dollar monthly growth engine, through phased design and data-led collaboration
“In less than two years, our redesigns helped scale SnappFood’s ad revenue
from about $26,000 to over $1.3 million per month — a 50× increase achieved through clarity, collaboration, and iterative strategy.”
📍 Context
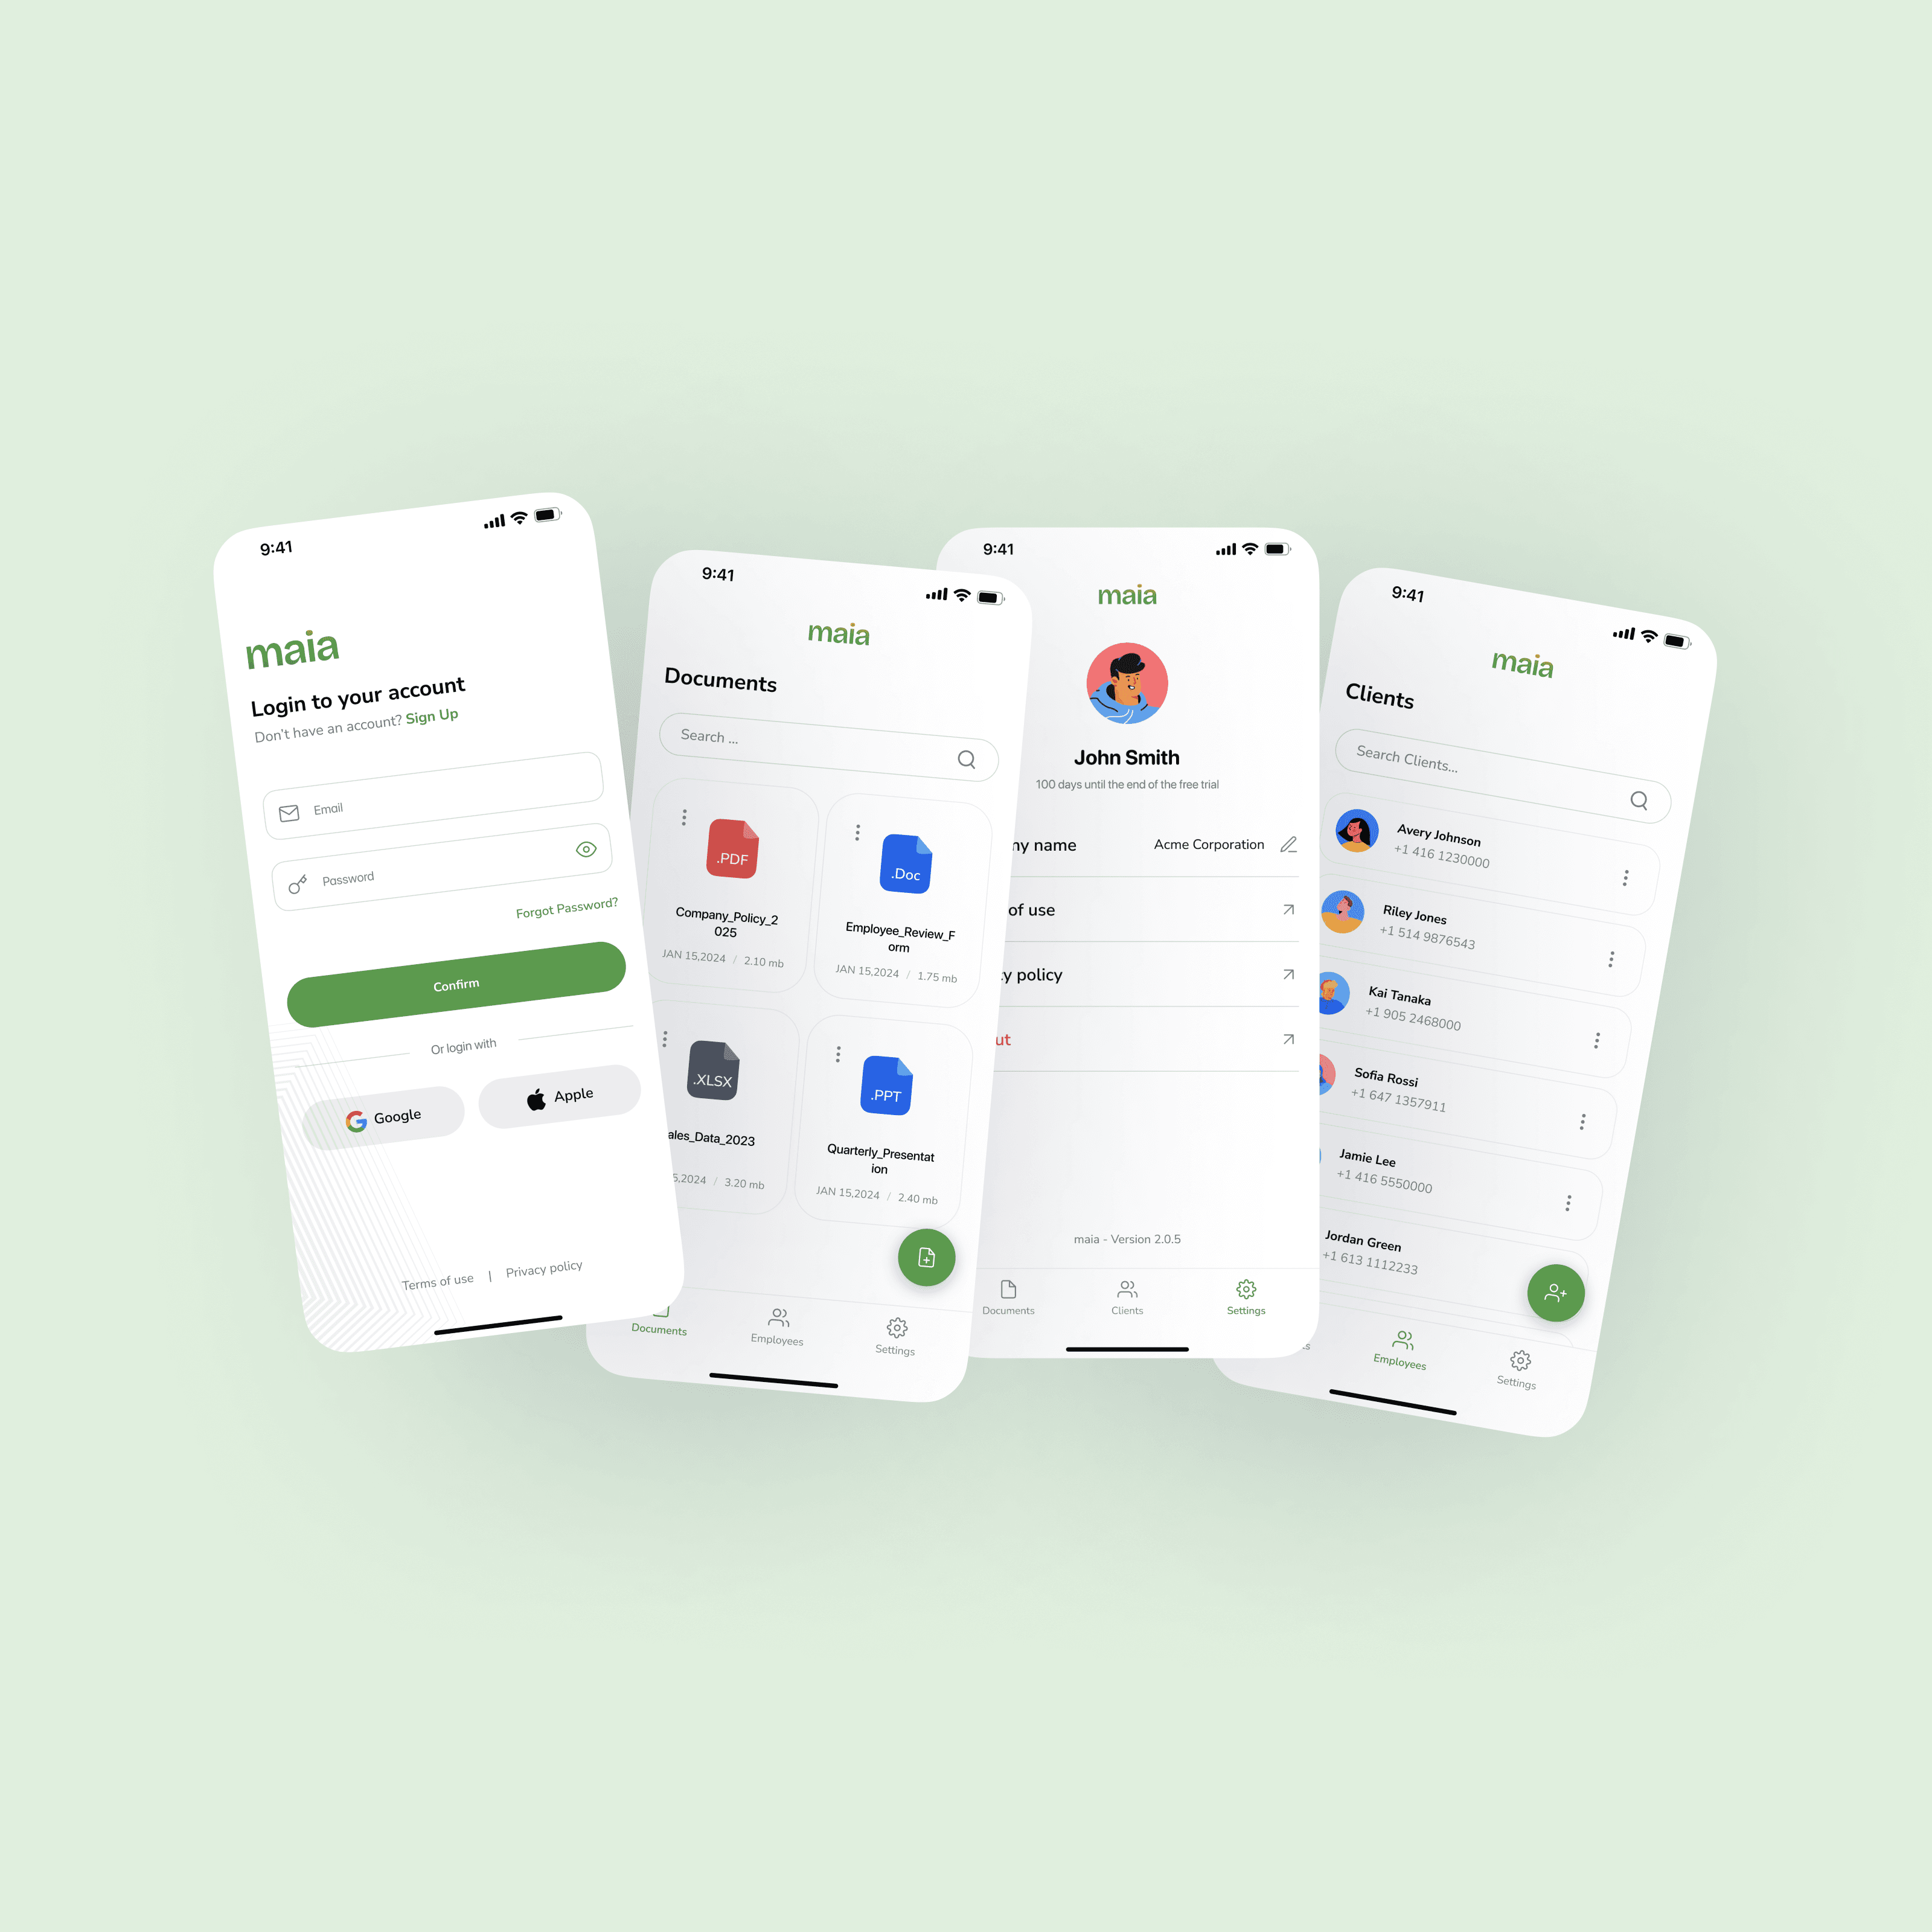
SnappFood is Iran’s largest food and grocery delivery platform, serving over 8 million users and 20 000 restaurant vendors.
Vendors manage their operations, performance, and marketing through Dakhl, SnappFood’s vendor-side app.
In 2022, the company launched a Cost-Per-Click (CPC) advertising feature that allowed restaurants to pay for better placement inside the customer app.
Although it had high potential, adoption was low — vendors didn’t understand how it worked, nor trust that it was worth the spend.
I joined as Product Designer & Design Lead for the Vendor Vertical, responsible for both design execution and strategic direction across all vendor-facing products.
Within the Vendor Ads & Promotion squad, our long-term goal was clear:
to make vendor advertising inside SnappFood simple, transparent, and profitable.
This vision unfolded in three iterative phases, each informed by data and cross-functional collaboration.
🎯 The Challenge
The initial CPC MVP faced five main problems:
Issue | Symptom | Impact |
|---|---|---|
Inefficient budgets | 40 % of campaigns ended prematurely | Wasted spend |
Unrealistic bids | 90 % below market CPC | Poor visibility |
Lack of education | No onboarding | Confusion, low adoption |
Limited control | Couldn’t edit live campaigns | Frustration |
Weak reporting | Minimal performance data | Low retention |
Our objective was to rebuild the experience gradually — not through a single redesign, but by addressing the highest-impact weaknesses one by one.
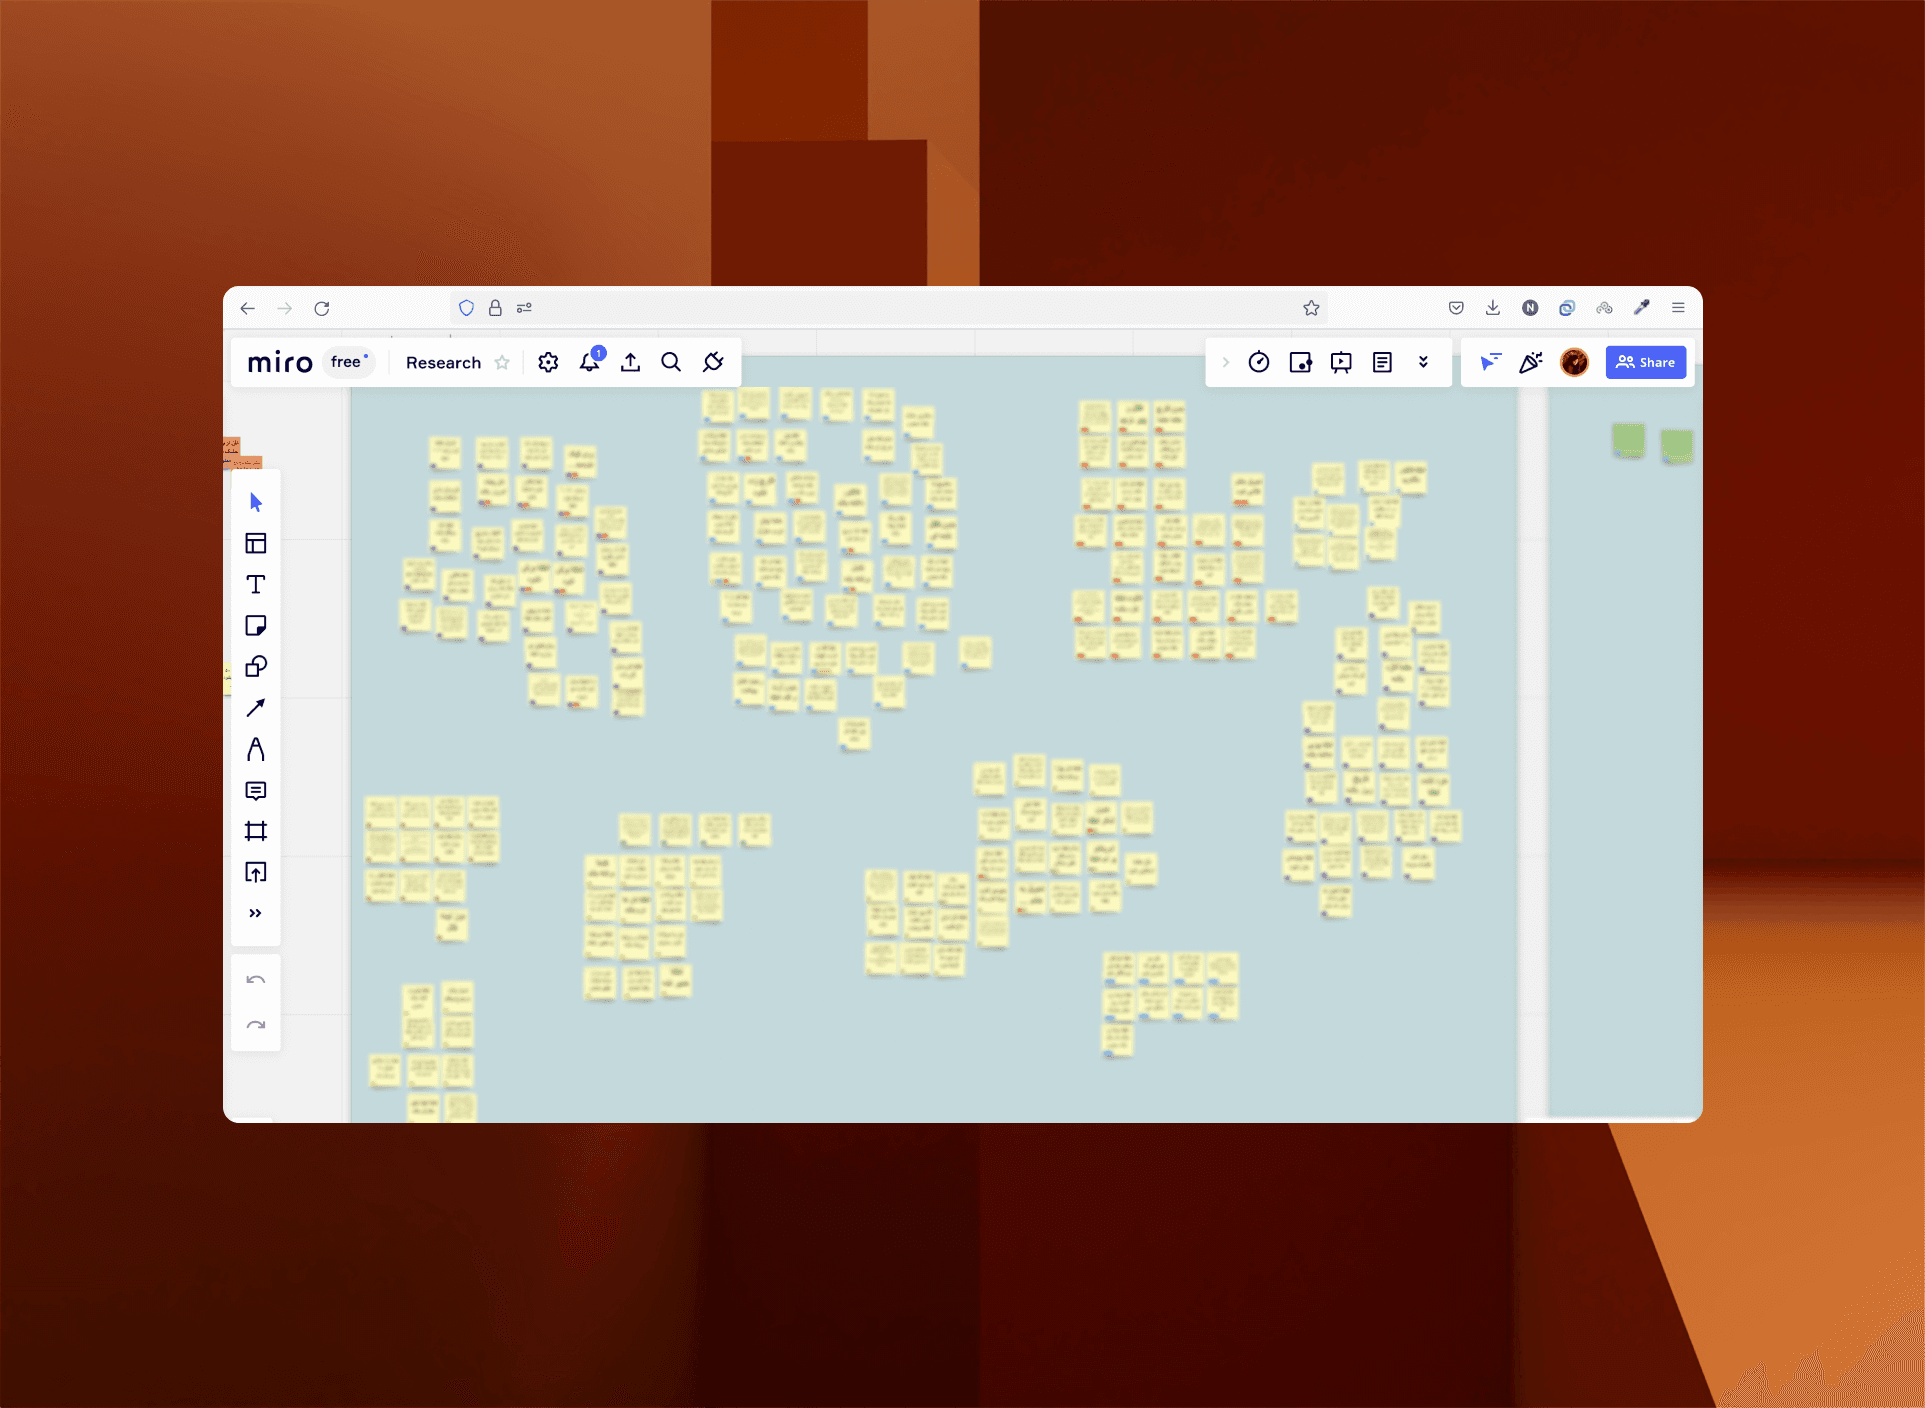
🔍 Discovery: Understanding the Problem
We started by partnering with our Product Manager and Data Analyst to extract and interpret behavioral data from Power BI and Google Analytics.
This combination of quantitative and qualitative research gave us a holistic view of vendor behavior.
Quantitative insights
60 % of campaigns lasted under 24 hours → short-burst strategy
42 % of failed campaigns had incomplete setups
Tier-1 vendors spent ≈ 2.4× more than Tier-2 vendors → opportunity for localized guidance
Weekend campaigns performed better → behavioral opportunity
Qualitative insights
400 survey responses + 15 vendor interviews
Core needs: understanding · confidence · control · feedback
Key finding: vendors weren’t reluctant to spend; they lacked clarity about value
🧩 Phased Design & Implementation
Rather than merging all problems into one redesign, we approached CPC evolution through three focused phases.
Phase 1 — Create Campaign Flow
(One-month sprint focused on the MVP bottleneck)
Our first priority was to fix the campaign-creation experience.
Most vendors were abandoning setup because the calendar was almost unusable, the budgeting process was confusing, and the CPC bid input offered no guidance at all.
Goals
Simplify the campaign-setup process
Help vendors make decisions using real data
Build a baseline understanding of CPC concepts and mechanics
1️⃣ Contextual Onboarding — introducing missing education
When we began, there was no documentation or in-product guidance explaining how CPC advertising worked.
Vendors had to guess what ad placements, bidding, or performance metrics even meant.
To address this, we added a short three-step onboarding directly before campaign creation.
Each screen used real app examples to explain what CPC is, where ads appear, and how campaigns impact visibility and orders.
Outcome: vendors finally had a built-in reference that clarified previously confusing concepts such as placement logic and campaign performance, laying the groundwork for better decision-making in later phases.
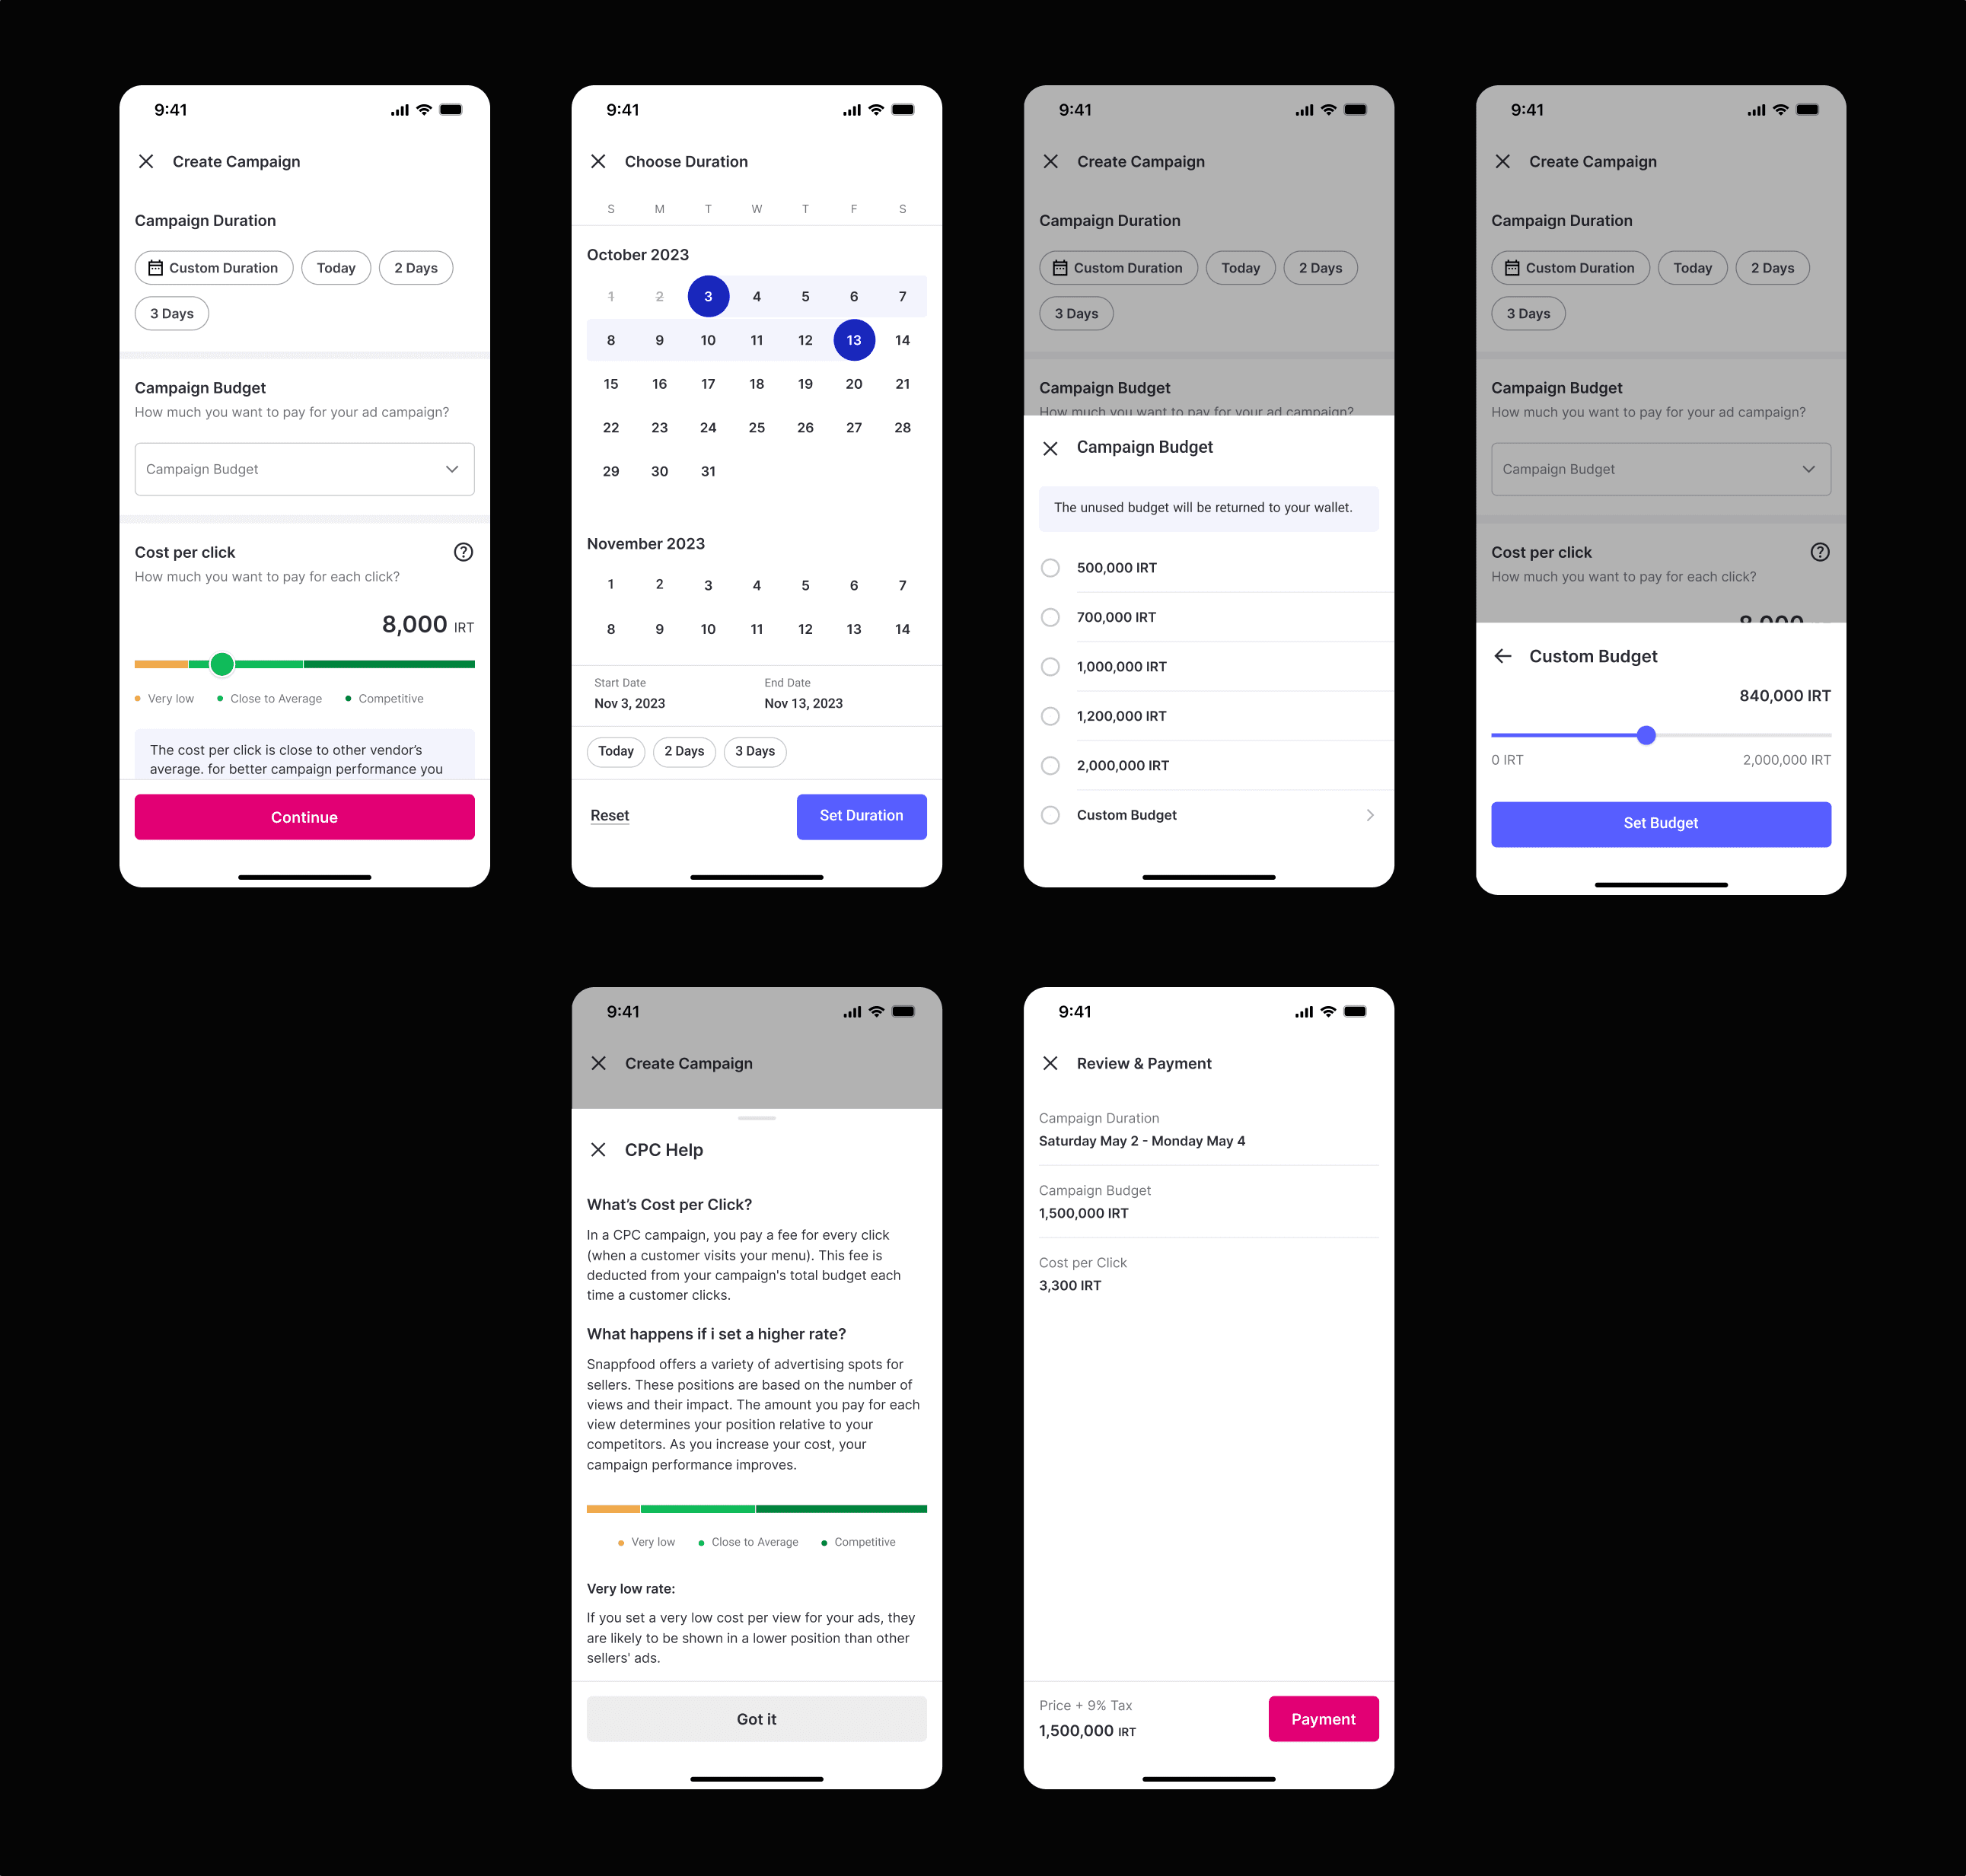
2️⃣ Budget Selection — from manual input to guided choices
The original MVP relied on a free-text field for campaign budget, which left vendors uncertain about what amount was appropriate.
We replaced it with radio-button options based on Power BI averages gathered with the Product Manager.
Budgets were displayed from lowest to highest to guide decisions progressively while still keeping a custom option for advanced users.
This change answered the question “How much should I spend?” through structure rather than explanation, helping vendors feel more confident about their initial choices.
Outcome: cleaner interaction, higher completion rates, and greater control over budget distribution without removing flexibility.
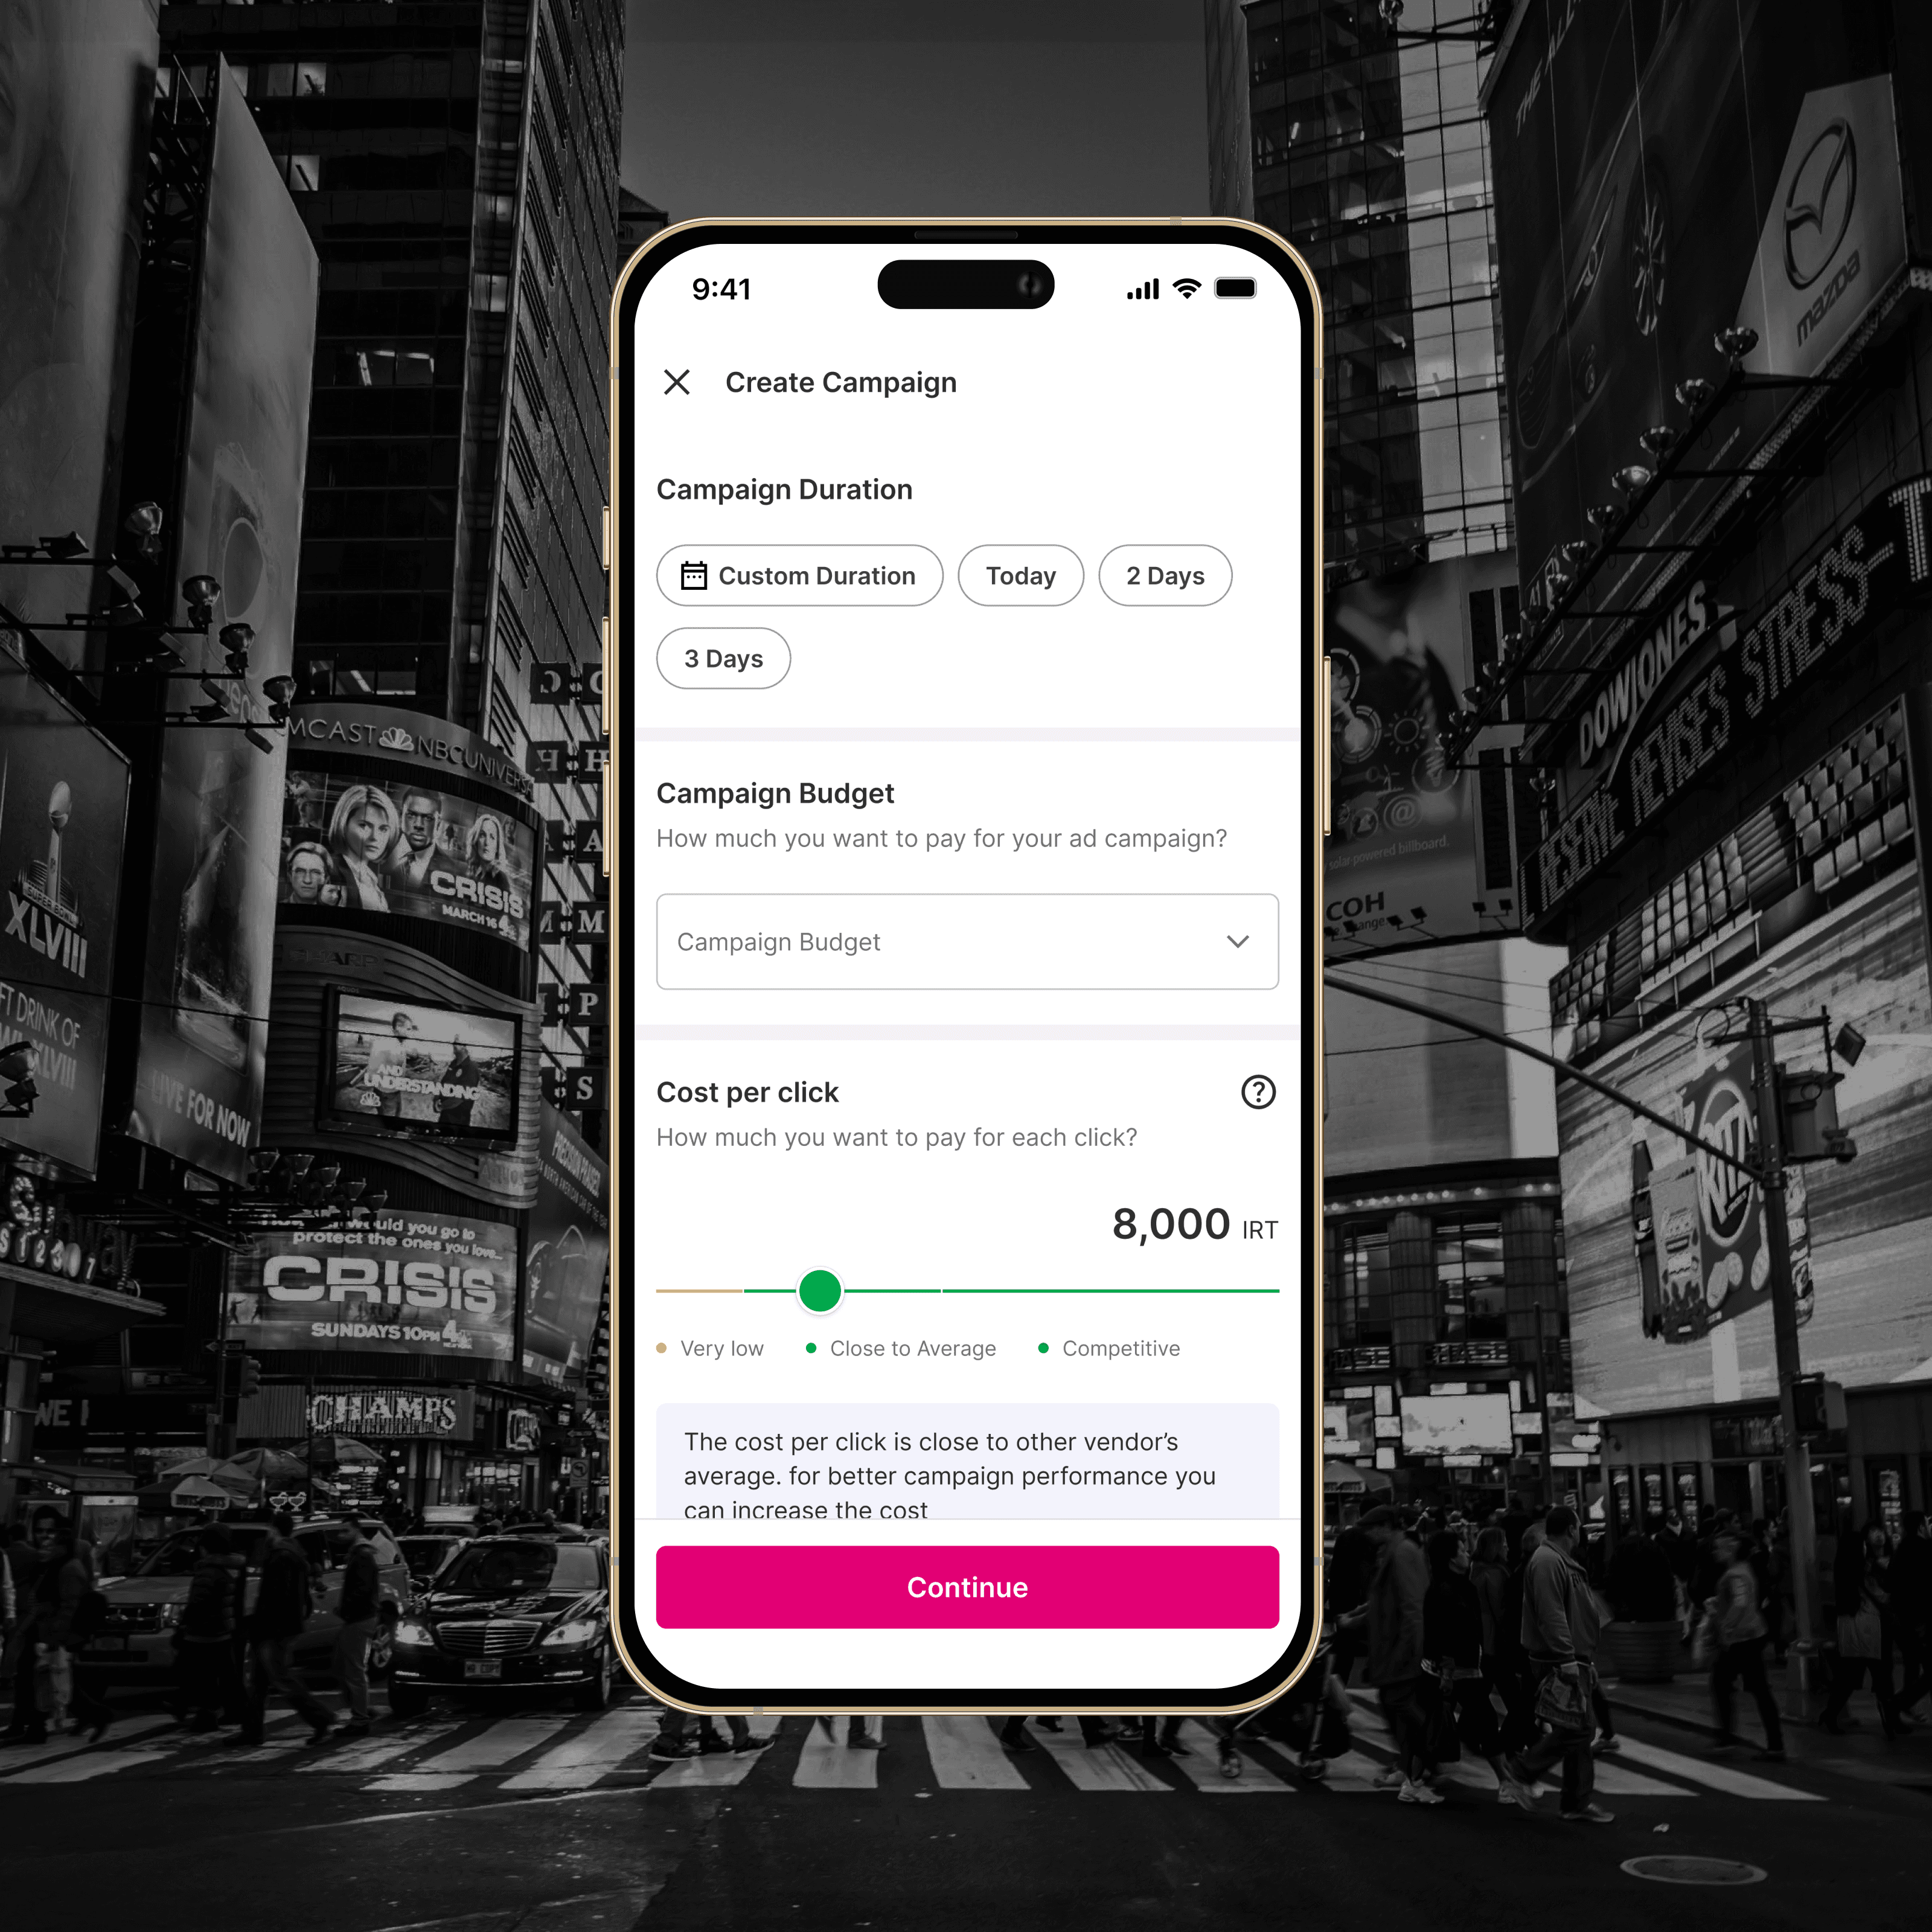
3️⃣ Campaign Duration — redesigning the calendar and adding intelligent chips
The calendar component was previously non-functional and a major source of friction.
I redesigned it completely and introduced suggestion chips—such as Today, Weekend Promo, and 7-Day Run—both on the main interface and within the calendar itself.
Analysis from Power BI and Google Analytics showed that most campaigns lasted one day or less, so the Today chip was visually prioritized and set as the default.
This redesign aligned the interface with real vendor behavior while keeping flexibility for longer campaigns.
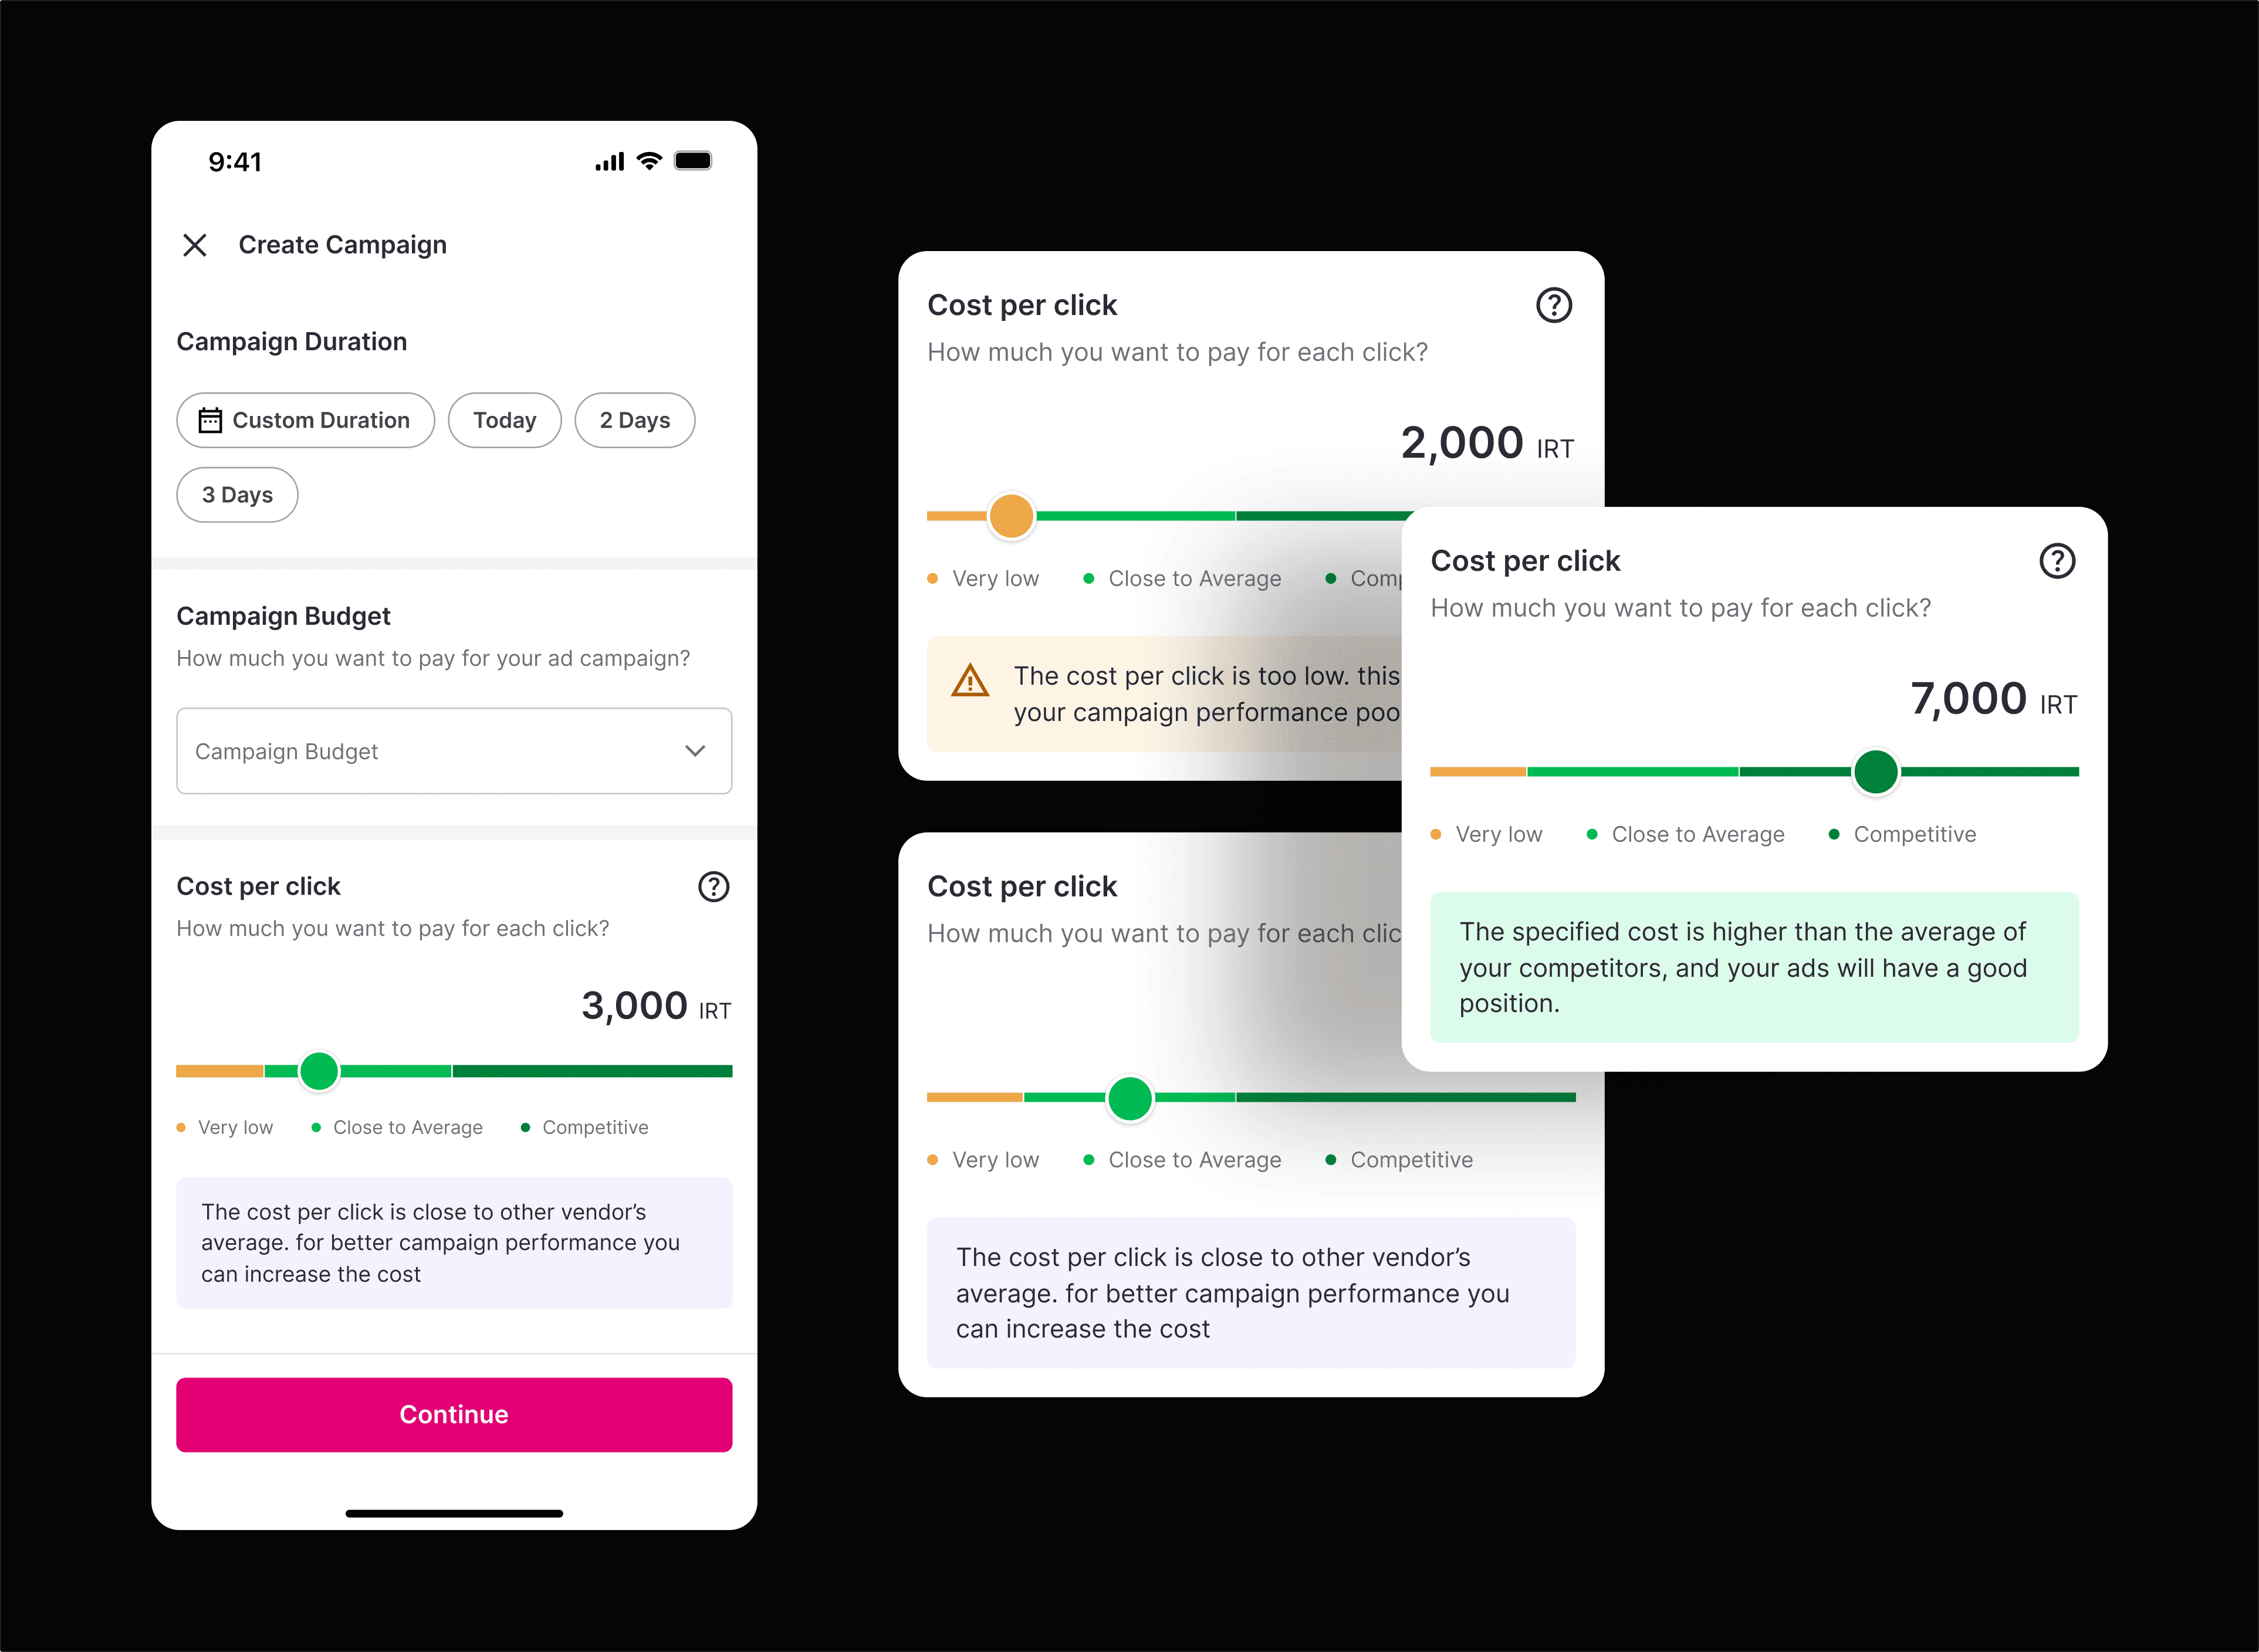
4️⃣ CPC Bid Slider — nudging behavior through transparent data
Previously, the CPC bid was just a plain number field.
I replaced it with a ranged slider divided into three semantic regions—Low, Average, and High—each paired with a short contextual message describing the impact of choosing bids from that range.
The default value was automatically set to the average CPC of the vendor’s area (from Power BI data).
Over time, as vendors selected higher bids, the regional averages increased, gradually shifting the slider’s balance—creating a self-adjusting system that improved bid distribution platform-wide.
These changes transformed campaign creation from a trial-and-error process into a structured, data-guided flow.
By clarifying terminology, improving usability, and adding subtle behavioral nudges, we gave vendors confidence to launch campaigns successfully and laid the foundation for later improvements in transparency and performance.
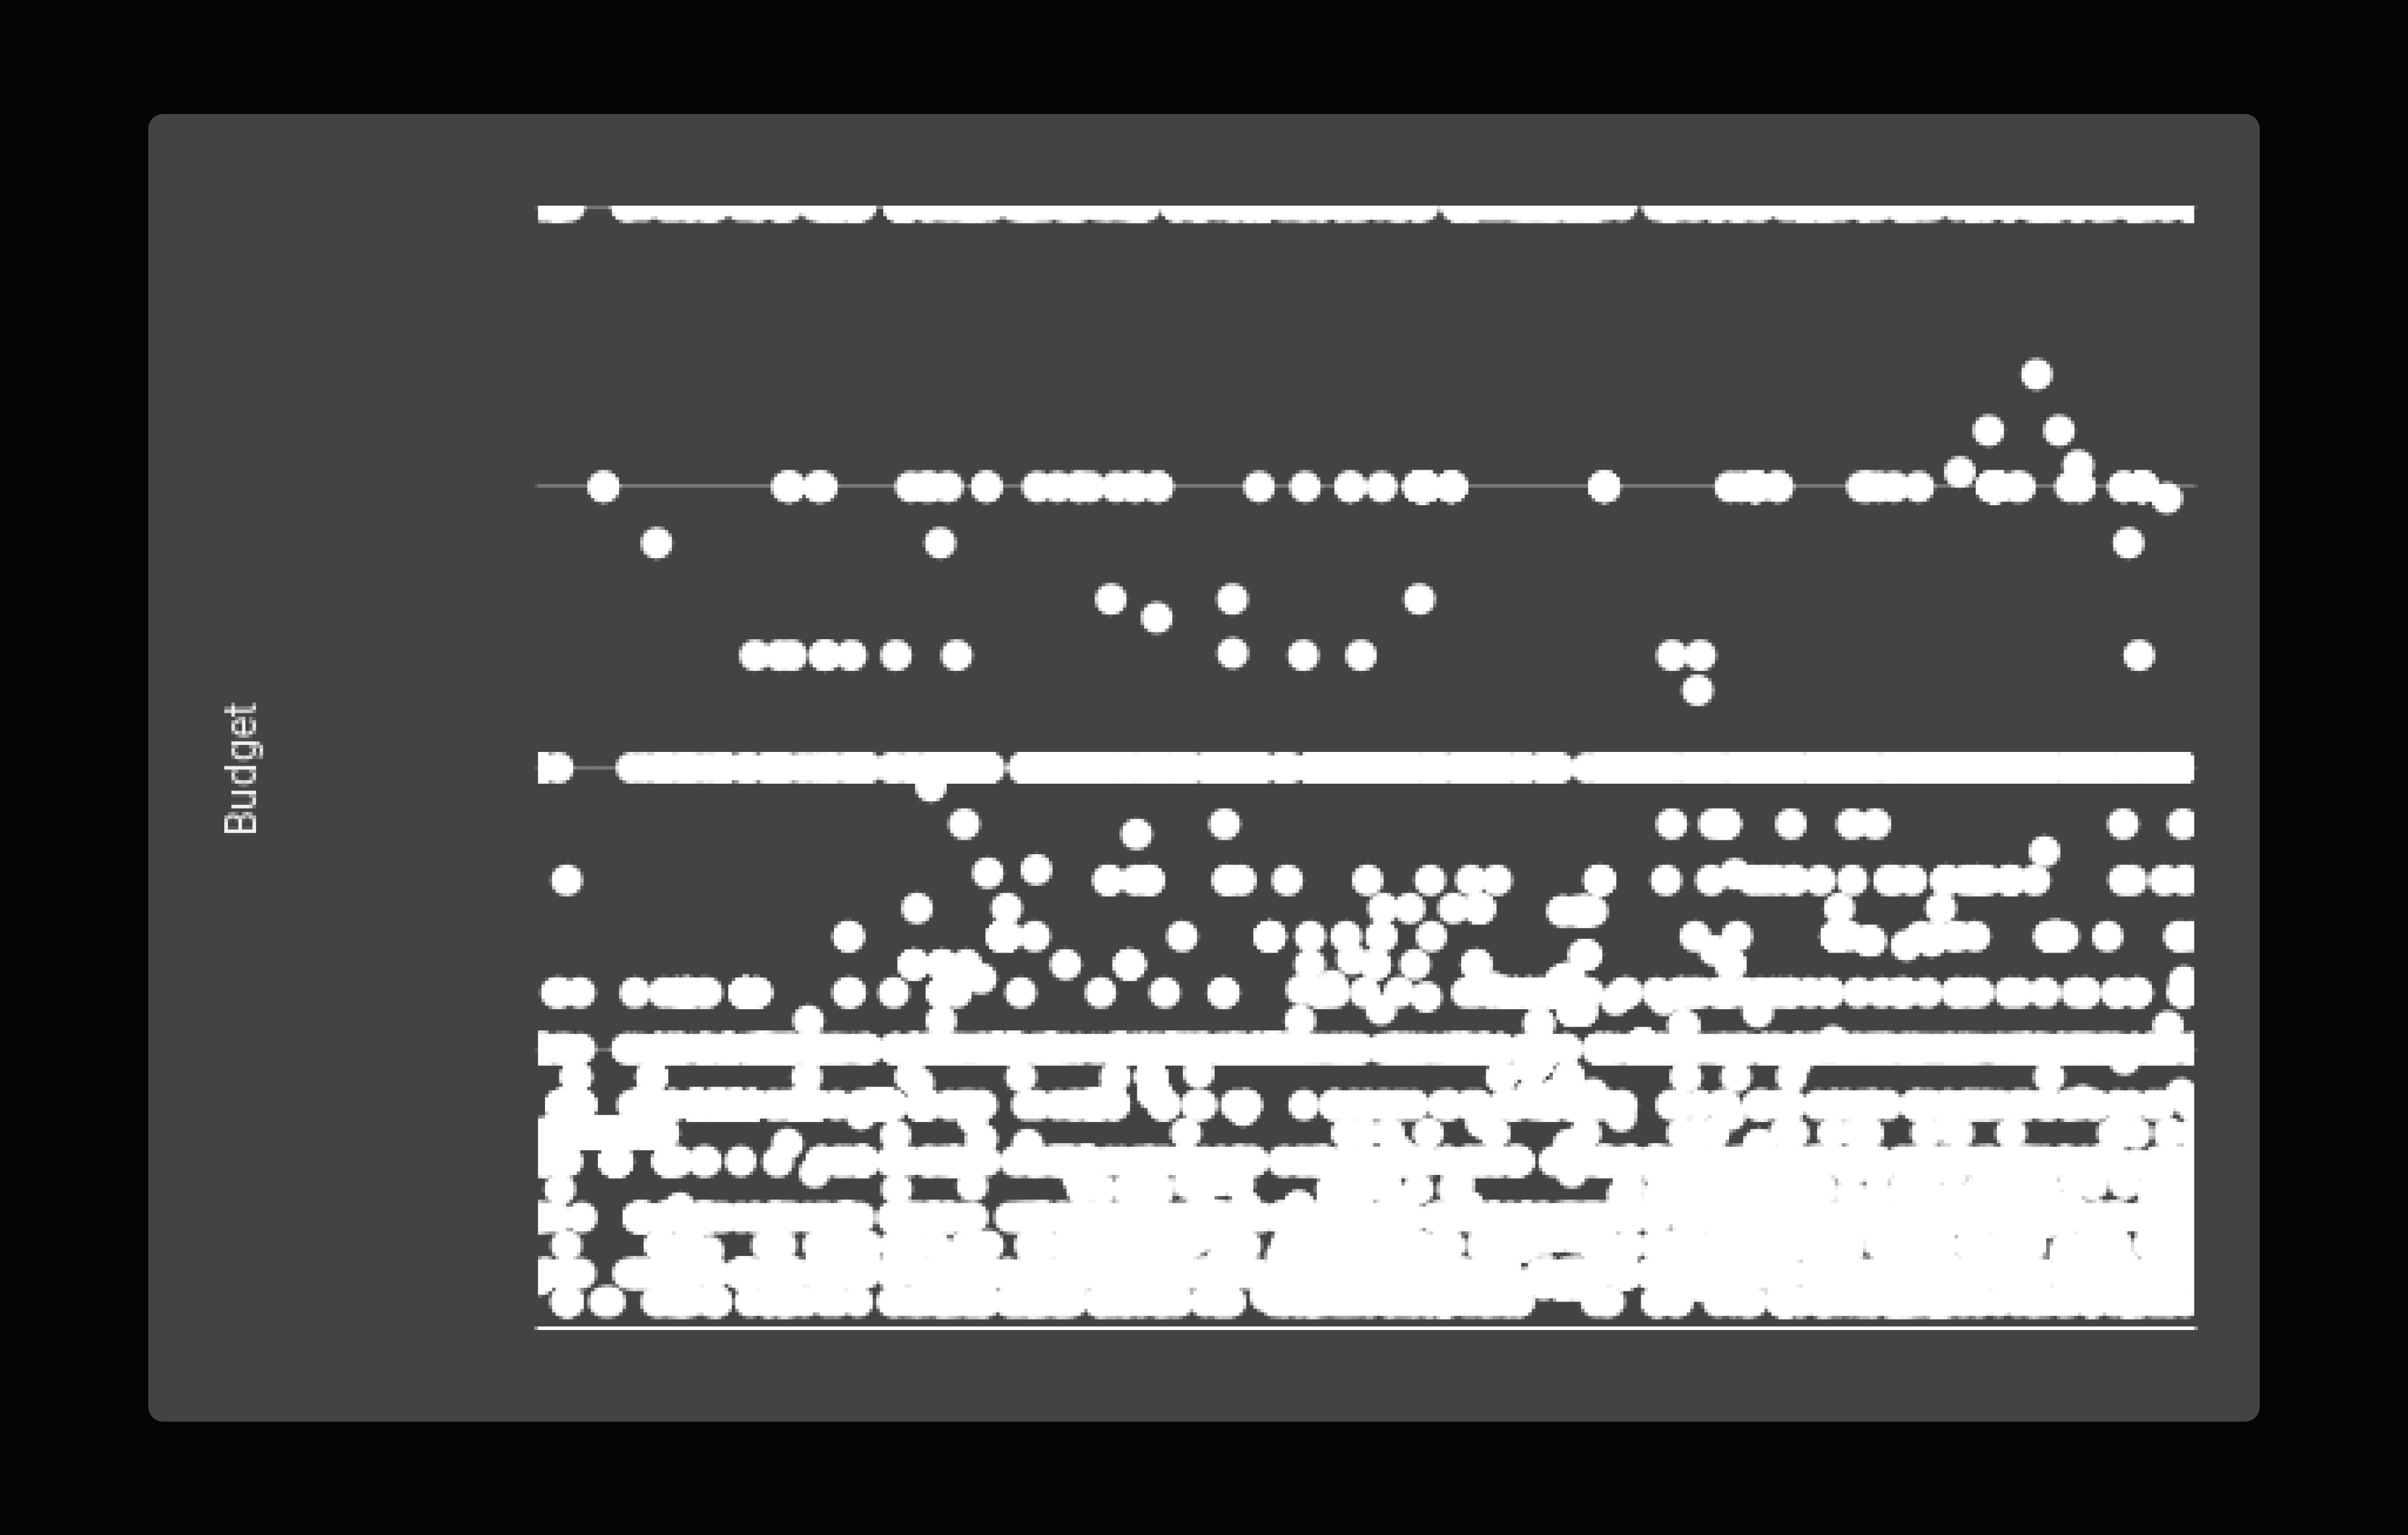
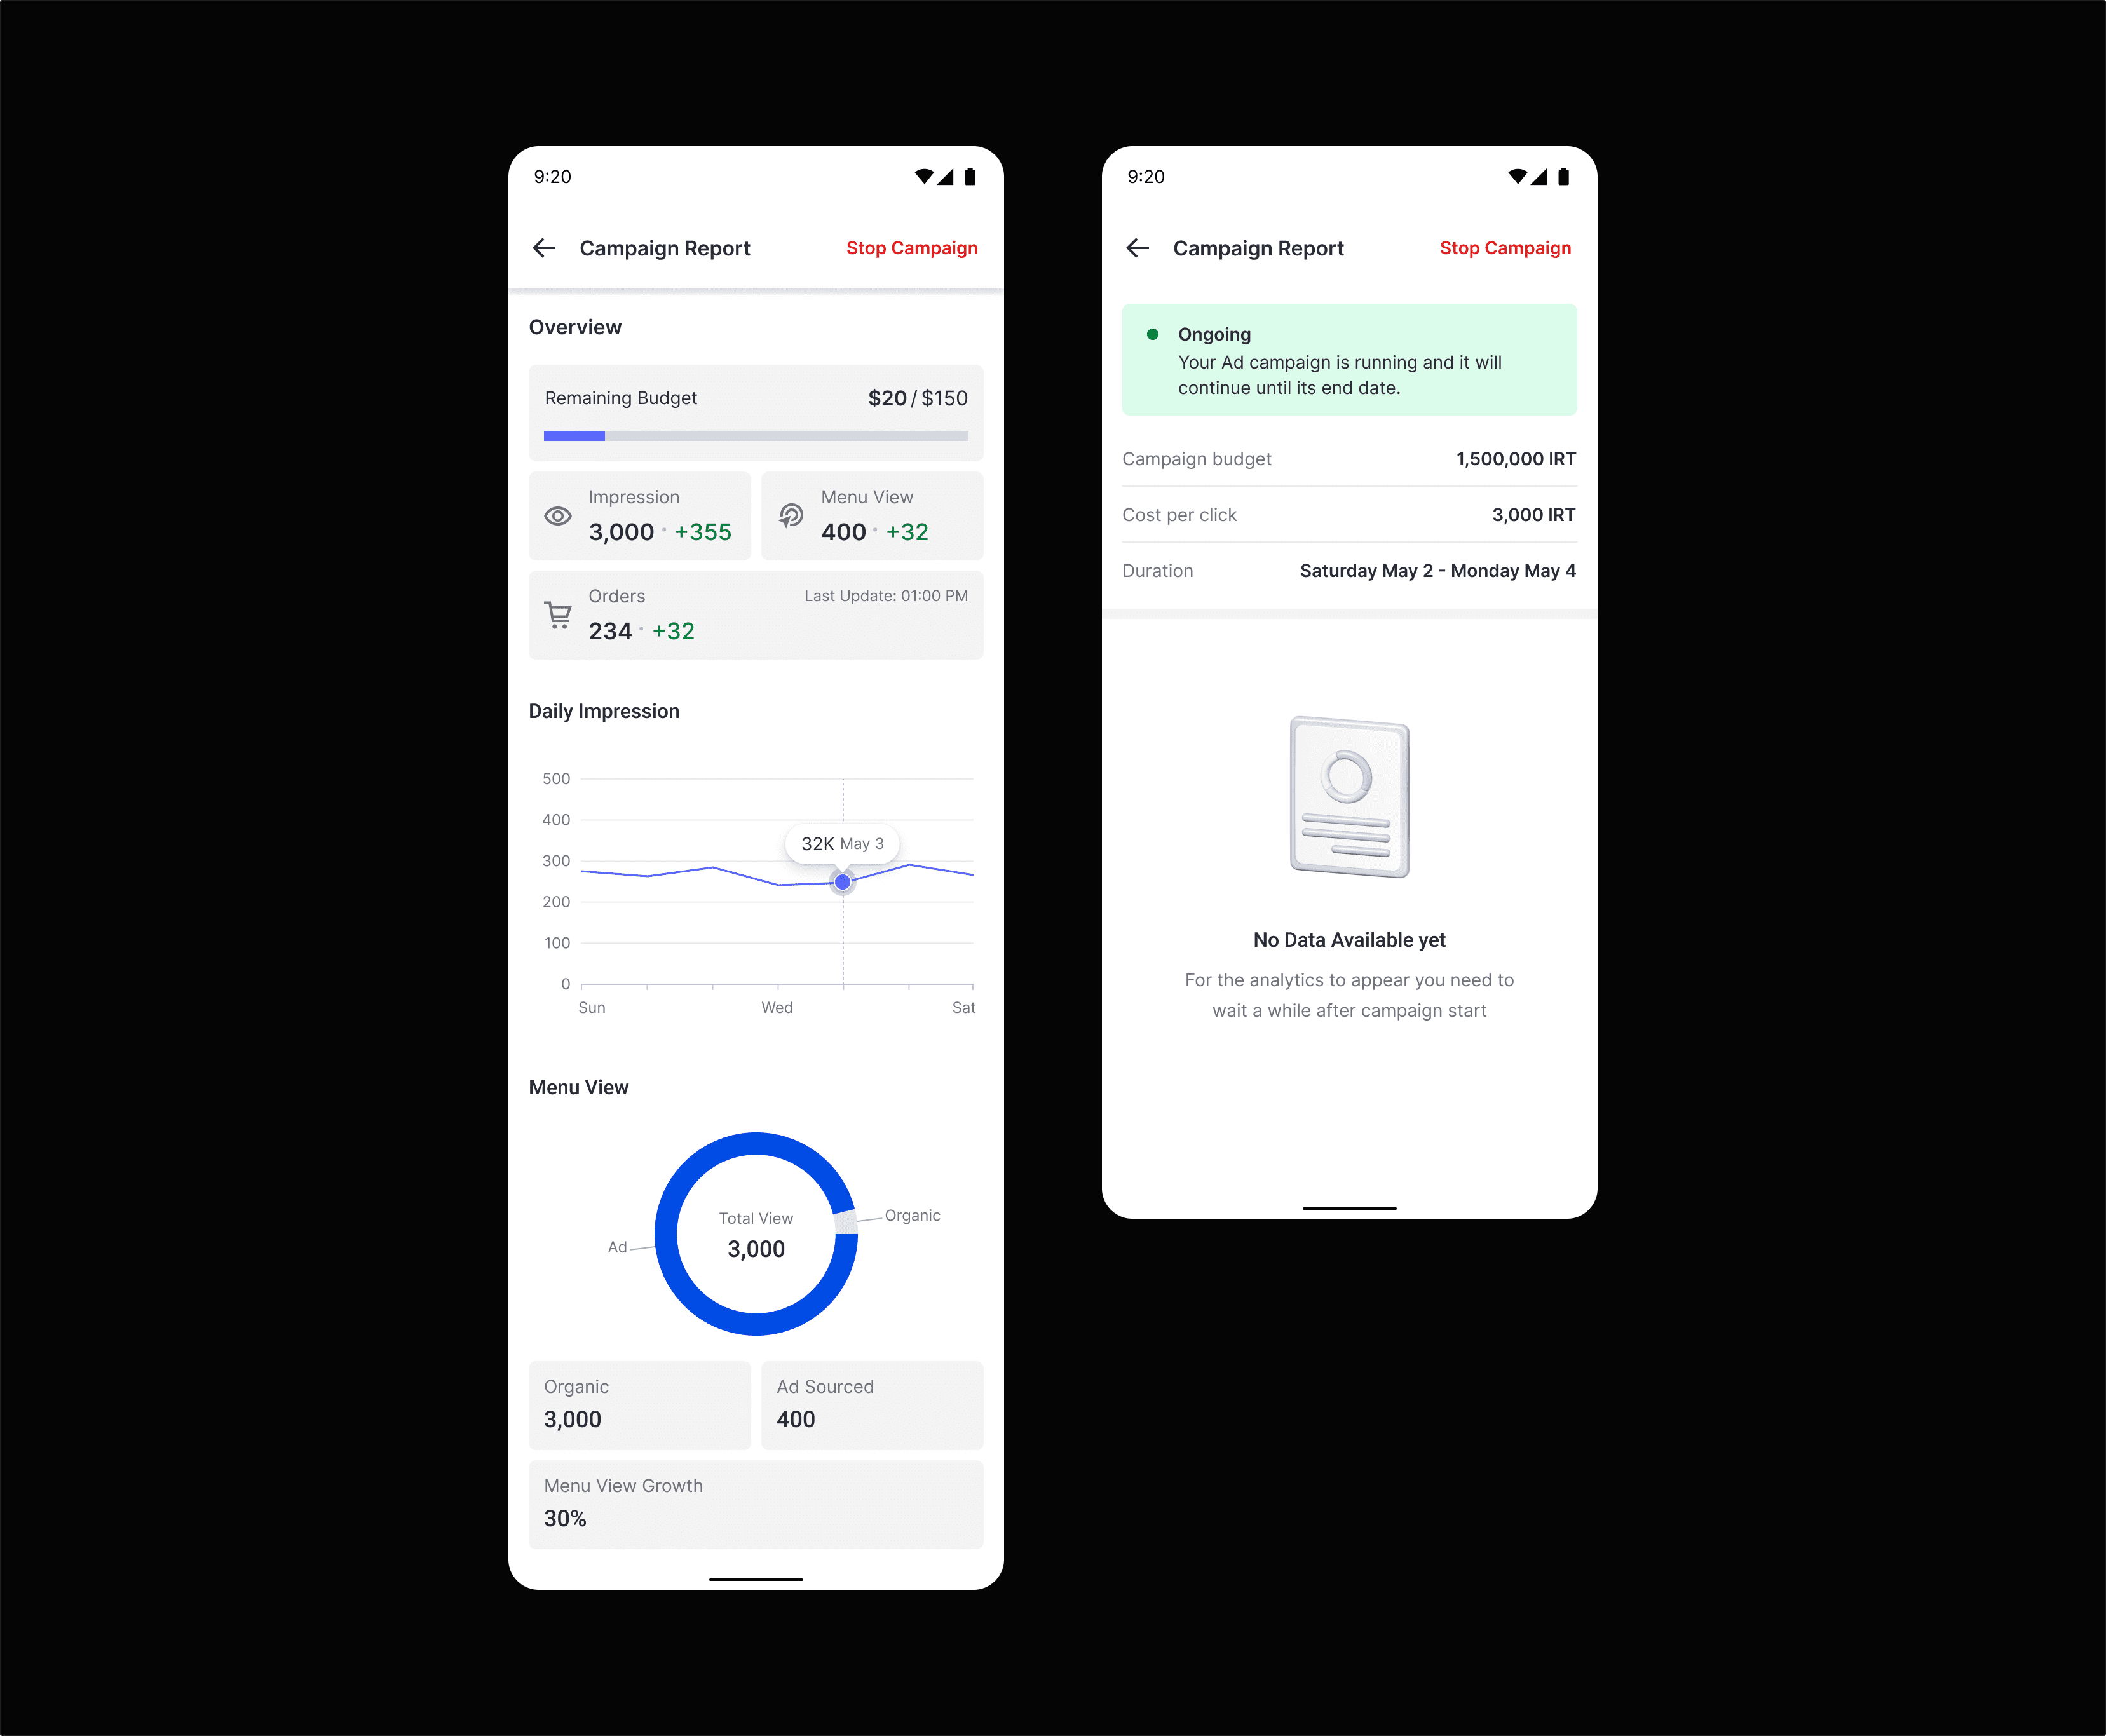
Phase 2 — Campaign Report Page
(Foundational iteration for transparency and learning)
The original reports page contained only two numbers — total orders and one other unhelpful metric.
Vendors had no sense of progress or impact.
We knew intuitively that vendors needed to see what their ads were doing, even before we could quantify results.
So we shipped a first, simplified reporting experience to start collecting behavioral data and qualitative insights.
Design Decisions
Displayed campaign status + budget progress
Added time-range view and basic shift details
Introduced KPI blocks for spend, ad views, store visits, and orders
Added graphs for ad impressions and store visits
Integrated early Power BI + GA instrumentation to observe usage
No success metrics were tracked post-launch — the goal was to learn.
Over time, usage analysis confirmed vendors interacted with the new view and shared feedback that informed later iterations.
(Image: New Campaign Report UI)
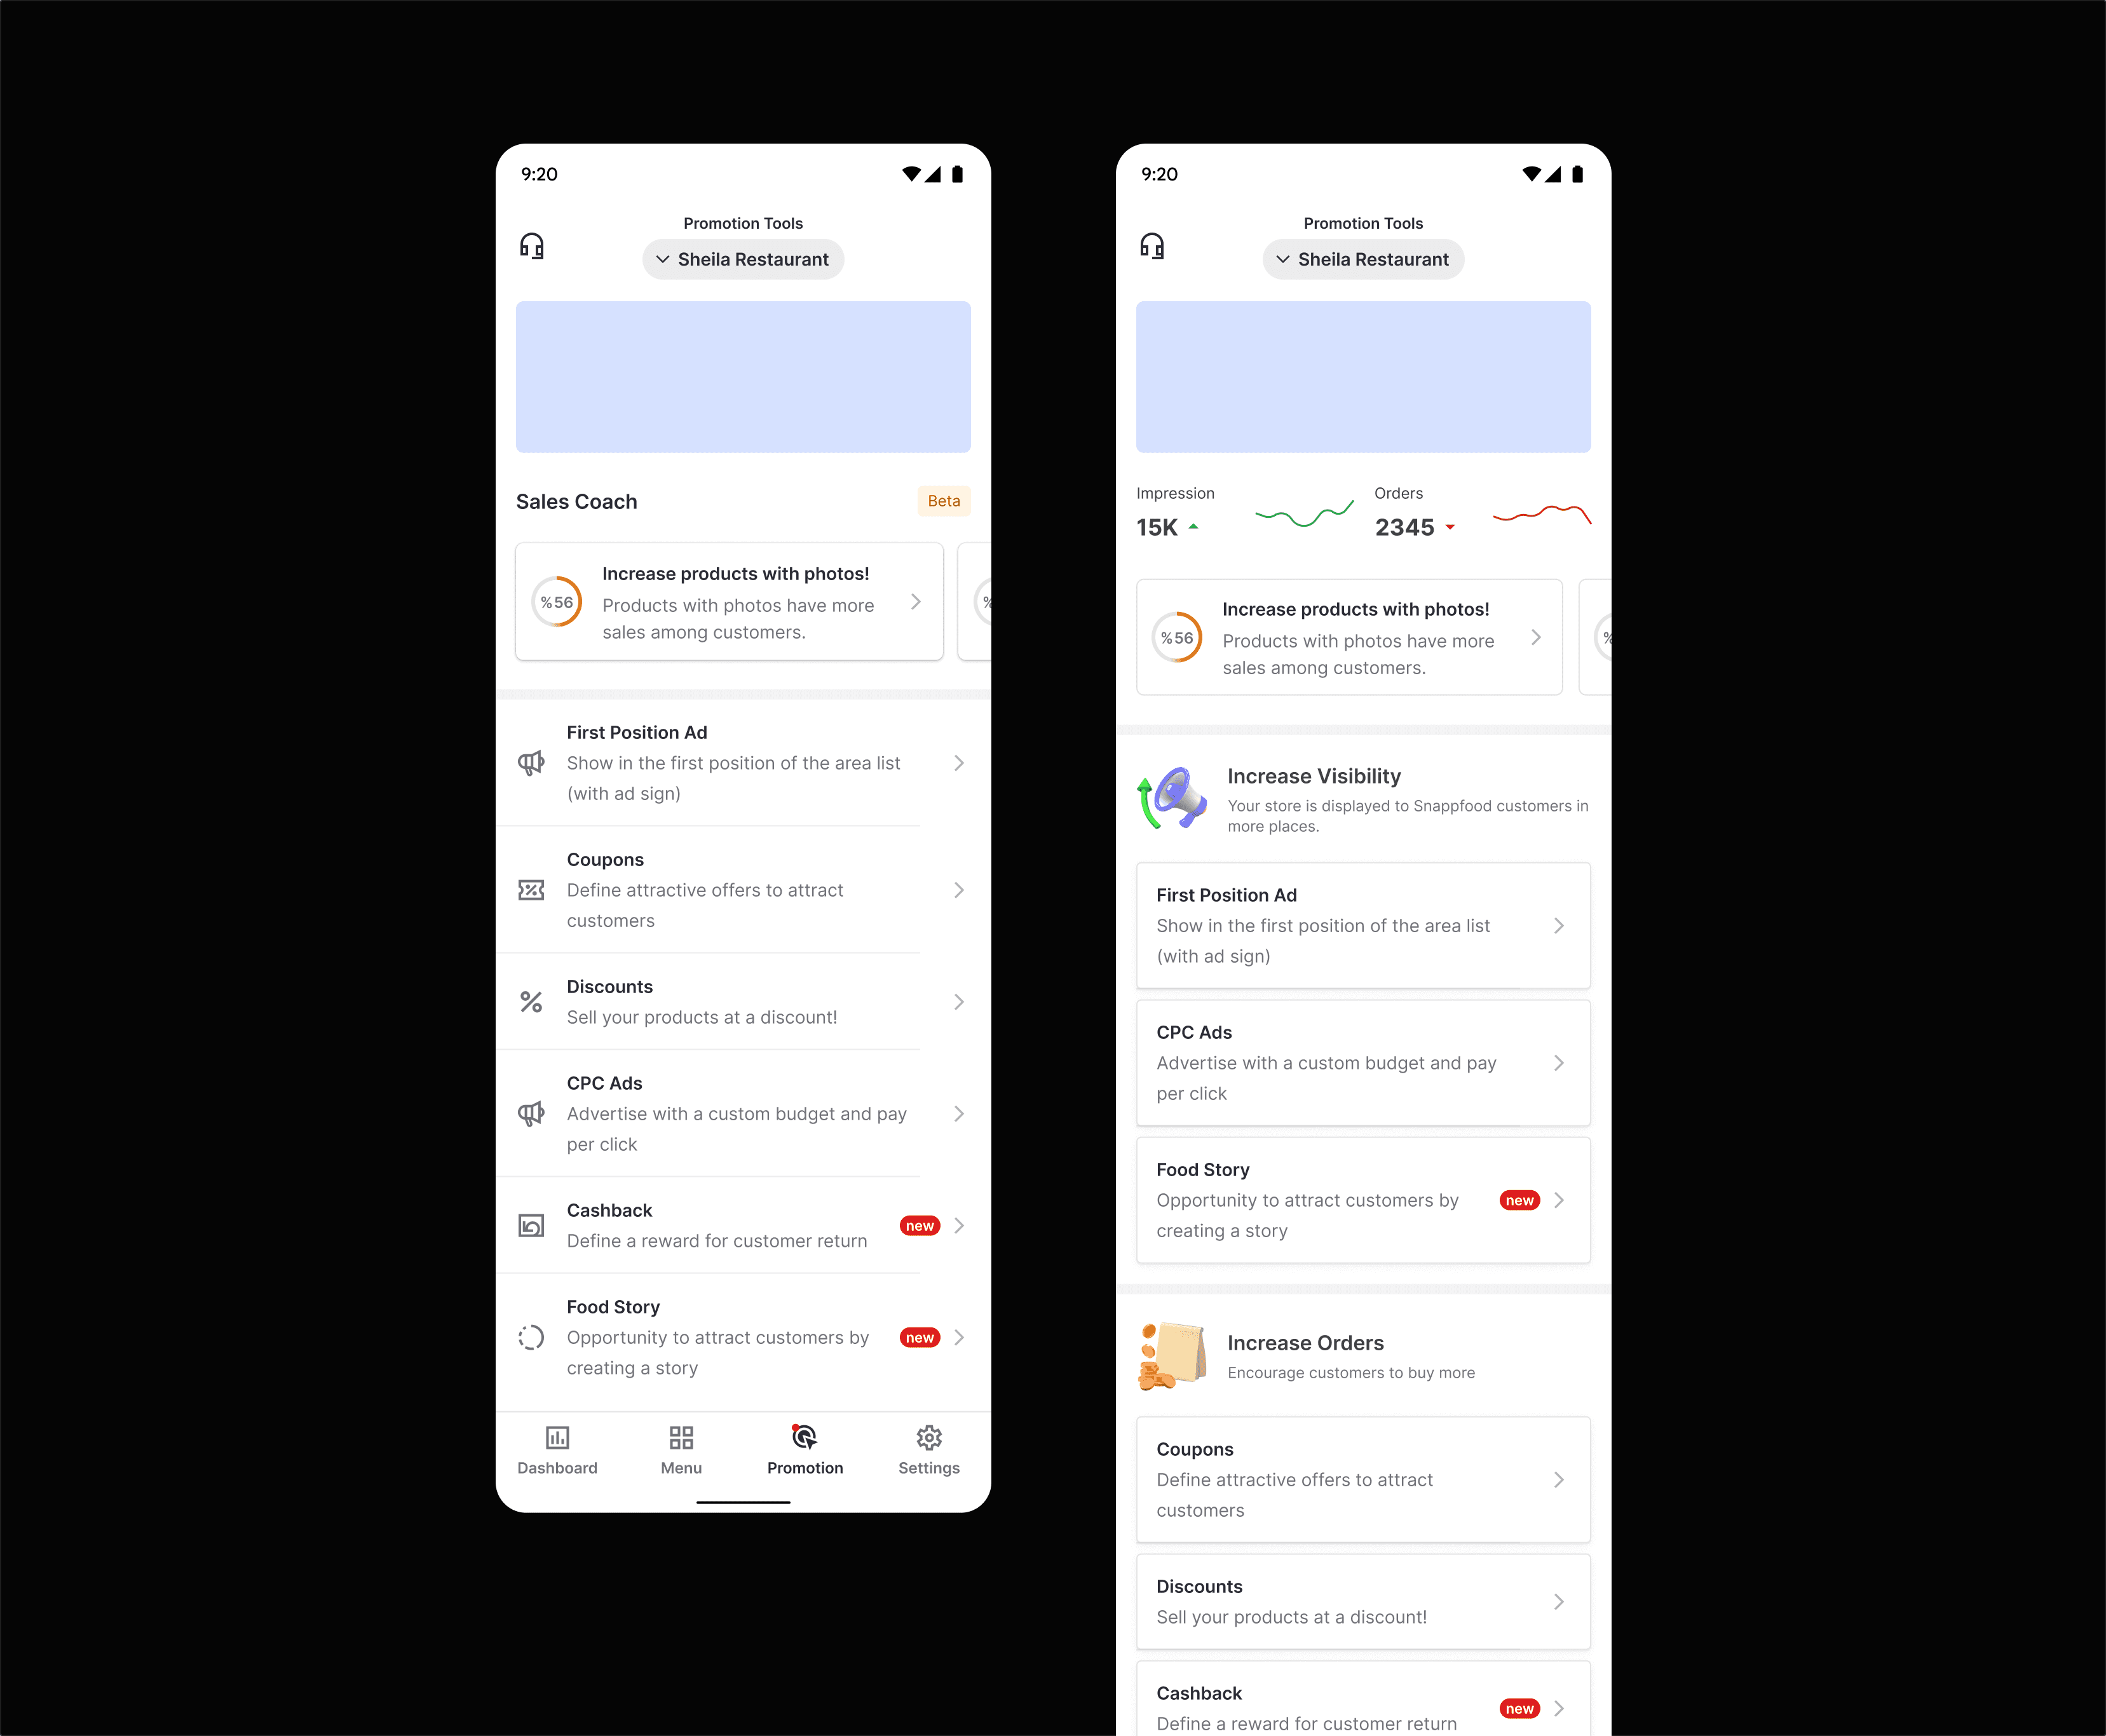
Phase 3 — Marketing Page (“Promotional Tools”)
(Growth iteration to reduce bounce and improve entry funnel)
Once the campaign experience stabilized, we noticed many vendors still didn’t reach the advertising flow at all.
The Promotional Tools page treated all marketing features equally, hiding CPC among discounts and coupons.
Goals
Increase traffic to the CPC entry point
Clarify each tool’s purpose
Improvements
We reorganized the tools into two conceptual tiers:
Tier | Purpose | Examples |
|---|---|---|
Visibility Boosters | Increase exposure | CPC Ads, Featured Listings |
Revenue Drivers | Drive orders | Discount Campaigns, Coupons, Vouchers |
⚙️ Collaboration & Cross-Team Dynamics
The CPC redesigns were a cross-vertical effort that relied on constant communication.
Product Management: defined success metrics and co-analyzed Power BI and GA data weekly.
Engineering: two FE, two BE devs, tech lead, QA — shipped incrementally.
Search & Discovery Team (Customer Vertical): expanded ad-slot inventory, which increased available exposure and supported higher budget utilization.
Design Leadership: as design lead for the vendor vertical, I maintained design-system alignment to ensure scalability across other vendor features.
Our approach: lean, data-informed, and iterative. Each release built a foundation for the next.
🧪 Results & Impact
Phase 1 (A/B Test)
Avg budget ↑ 18.28 %
Avg CPC bid ↑ 21 %
Immediate revenue ↑ 36.77 %
Phase 2 (Reports Page)
No quantitative KPIs collected — purpose was learning.
Qualitative feedback validated direction and informed future optimization.
Phase 3 (Marketing Page)
Bounce rate ↓ 25 %
CPC flow traffic ↑ significantly
18 months later: CPC ad revenue grew from ≈ $26 000 to ≈ $1.3 million per month (≈ 50× growth).
The results reflected not just design impact but coordinated scaling by product, data, and engineering teams.
🔬 Post-Launch Research & Next Steps
After completing these phases, we saw diverse vendor behaviors that our analytics couldn’t fully explain.
I initiated a qualitative research project with our UX Research team, inviting vendors from various categories for in-depth interviews.
We synthesized findings into an Opportunity Solution Tree, outlining future possibilities such as:
Smart budget automation
Comparative reporting features
Vendor-side A/B testing
This marked our transition from intuition-driven to evidence-driven design.
💡 What I Learned
Phased delivery builds clarity: each release solved one layer of the problem.
Education drives conversion: clarity raised spending more than incentives.
Power BI + GA collaboration turned raw data into actionable insight.
Cross-team alignment is the real growth engine.
Design = strategy: UX decisions directly affected revenue scale.